Season 3 Recap
Hello all, most of this was written ~2 weeks ago so I'm finally now sitting down to finish and post it, but before we begin-
As some of you may have already heard, Diogo Jota and his brother, Andre, died in a car crash today. I don't think I am necessarily someone who should be talking on the matter, but Diogo was an incredible footballer and I always enjoyed watching him play. In my years of watching the PL and everything, I've only ever heard that he was a genuinely wholesome and kind individual. If you're interested in reading some tributes to him, I definitely recommend Andy Robertson's -- it is incredibly heartfelt and beautifully written.
There's a lot more I could say, but I'm just heartbroken for his family and the news really did come as a shock to me this morning.
RIP Diogo and Andre
From here on, most of this was written a while ago so expect a bit of a tone shift.
Finally, I've found some time to sit down and look at some stats! So let's begin with all the fun graphs and things that weren't included in the last two weekly updates, shall we?
League Table

As I mentioned earlier, MatthewR won the league by a whopping 7 points, with Kevin, Luke, and Matt rounding out the top 4, myself and Gavin picked up 5th and 6th, and Rebecca snuck into 7th on the final day.
To start, let us take a look at MatthewR's league win as compared to other seasons:
- Most points in a season - 89
- Season 1 - 88
- Season 2 - 82
- 6th highest points for - 1529
- Season 1 - Darryan (1589), Matthew (1621)
- Season 2 - Matthew (1912), Dylan (1587)
- Season 3 - Luke (1580)
- Most wins in a season - 29
- Season 1 - Darryan (28)
- Season 2 - Matthew (27)
- 2nd least losses - 7
- Season 1 - Darryan (6)
- Season 2 - Matthew (10)
- 2nd highest point differential - +366
- Season 1 - Matthew (+349)
- Season 2 - Matthew (+547)
I think there are a few other notable features of this table as well, including:
- Luke with the highest points for (1580)
- Kevin's 82 points is the highest point total for a non league winner and was enough to tie the points total of the league winner last season
- Passed 2nd placed Season 1 Matthew (79)
- Darryan 0 point differential
- Soph -56 point differential while in 14th
- 2 managers over 1500 points, 6 over 1400 points, 9 over 1300 points
Next, let's turn our attention over to the copium tables!
Copium Tables
Performance Table
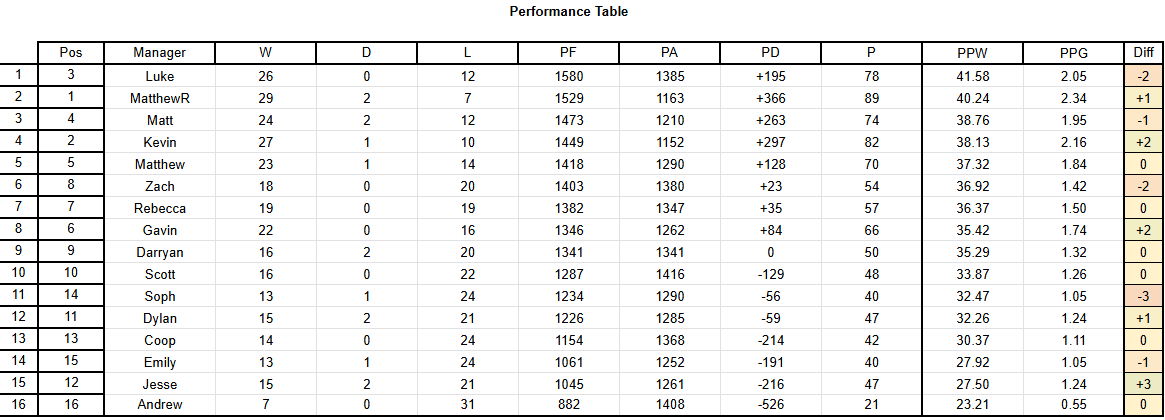
Some comments and fun things to note:
- As mentioned before, Luke finished at the top
- Overperformers:
- MatthewR, Kevin, Gavin, Dylan, Jesse
- Underperformers:
- Luke, Matt, Zach, Soph, Emily
- The above are in the strictest sense of the words, but we'll dive into the luckiness of managers in a bit :)
- The biggest differences are +/- 3 which isn't too bad (we had a -4 last season, which puts Zach on a cumulative -6 underperformance)
Luck Table
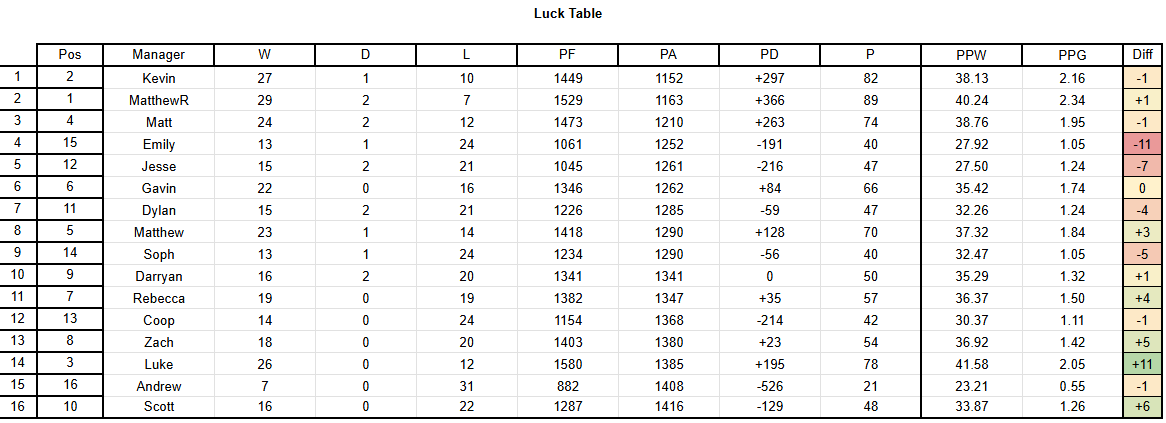
Ah yes, the luck table. What a sight to behold. Yes that is both a plus and minus 11.
- Kevin, MatthewR, and Matt taking up the top 3 spots is funny
- Kevin had a whopping 100 points less against him than Emily did, who was 4th luckiest. The next 100 point gap is to Coop at 12th luckiest.
- Luke down in 14th yet finished in 3rd (that's 6 points per week against more than Kevin)
- Andrew, Scott, and Zach also got pummeled by PA
- Me and Soph both had 1290 PA which was just under average (1300)
xP Table (manager vs average)
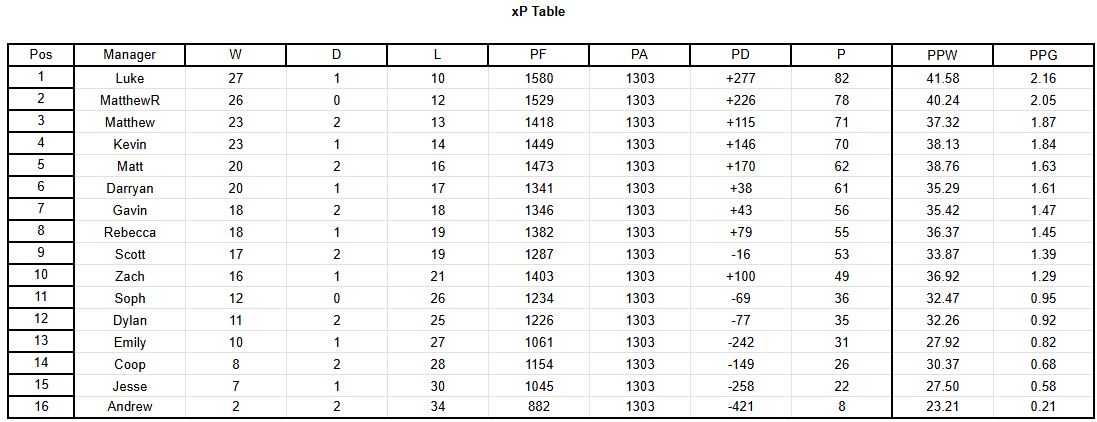
Ah yes, the luck table but more complicated. One thing to note for this table is that it measures weeks above average. So if you consistently scored slightly above average, you'd have more wins than someone who put up 60s and 20s.
- Luke barely takes 1st over MatthewR in this one
- I come in 3rd, barely over Kevin
- Huge gap from Kevin to Matt and Darryan
- Overall, this table is pretty accurate
And now, to introduce: the new xP table! Which consists of Manager vs Everyone.
In short, this table calculates how many wins, draws, and losses someone would have in any given week if they were to play all 15 other managers, then averages that out! So the highest scorer would get 3 points, second highest would get 3 * 14/15 and so on.
New xP Table (manager vs everyone)
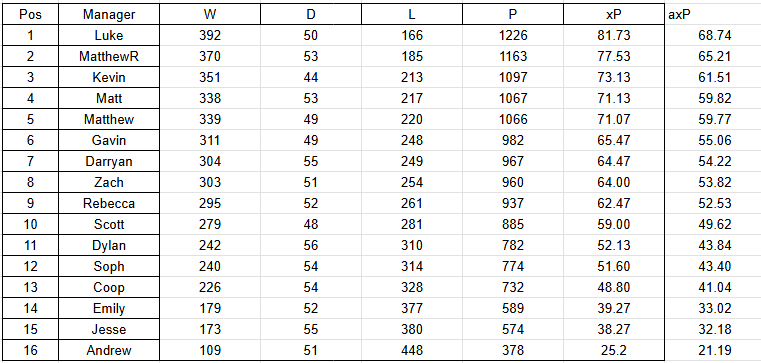
Now, this table has some interesting similarities with the old table, such as (in old xp vs new xp format):
- Luke: 82 vs 81.73
- MatthewR: 78 vs 77.53
- Kevin: 70 vs 73.13
- Matthew: 71 vs 71.07
- Darryan: 61 vs 64.47
One thing to note here is that these models do a decent job at predicting expected points on the upper end of the table, barring some outliers (such as Matt 62 vs 71.13), but the new xP overestimates managers lower in the table. I believe this is just because there are more available points with the new model, so it should be taken as a relative comparison rather than a direct one. (Total points is 795 vs 945.27)
In fact, if I directly adjust it so that the available points in the new xP model is the same (by multiplying by 0.881), it does bring a lot of the midtable "overperformers" down closer to their old xP values. Certainly there is a statistics-y way to do this as a normal curve or something to better distribute the points but my one stats class didn't get that advanced.
Anyway, I did want to look at this table relatively, as well, so let's do that (listed by new xP position, then old xP / finish):
- Luke: 1 / 3
- MatthewR: 2 / 1
- Kevin: 4 / 2
- Matt: 5 / 4
- Matthew: 3 / 5
- Gavin: 7 / 6
- Darryan: 6 / 9
- Zach: 10 / 8
- Rebecca: 8 / 7
- Scott: 9 / 10
- Dylan: 12 / 11
- Soph: 11 / 14
- Coop: 14 / 13
- Emily: 13 / 15
- Jesse: 15 / 12
- Andrew: 16 / 16
That puts the accuracy of the predictors at:
- Old xP: 1/16
- New xP: 8/16
Difference between predicted and actual (cumulative):
- Old xP: 25 places
- New xP: 14 places
Woah. That's a huge improvement to accuracy. And also that's right, Andrew was the only manager that the Old xP table correctly predicted the finish of.
Next season, I'll probably keep around both tables (because why not) and also have the option to expand the New xP table to include scores from both leagues!
Next up we will take a look at some season stats!
Statistical Breakdowns
Gameweek Breakdown

- High scoring week was Gameweek 33 with a 40.25 average
- 8 scores of 40+
- Marked the highest "Low Score" of any week with 26
- Lowest scoring week was Gameweek 29 with a 27.63 average
- The most managers in any given week to score 50+ was 4, in Gameweek 2
- 3 managers scored 50+ in any given week 7 times!
- Only 4 70+ gameweeks this season
- Gameweeks 22, 24, 27, 32
- Lowest "High Score" of a gameweek was 46, in Gameweek 8
- The first half of the season average was 33.89, the second half was 34.50 (0.61 difference)
- Half of the league scored in any 10 point range twice:
- Gameweek 19: 20-29
- Gameweek 22: 30-39
So, how did the distributions compare season over season? (Season 2 / Season 3)
- 0-9: 0.7% / 0.7%
- 10-19: 7.0% / 9.2%
- 20-29: 23.7% / 27.8%
- 30-39: 27.3% / 30.9%
- 40-49: 23.3% / 21.1%
- 50-59: 11.6% / 6.7%
- 60-69: 4.0% / 3.0%
- 70-79: 2.2% / 0.5%
- 80-89: 0.7% / 0.2%
- 90-99: 0.2% / 0.0%
This is about what I expected, with most of the 50+ scores falling away and being replaced by increases from 20-40.
Manager Breakdown

- Darryan and Rebecca each scored in the 30s 18 times
- MatthewR and Luke each scored 40+ 22 times
- The only manager to not score 50+ was Jesse
- Matt scored 50+ 8 times (Luke/Zach/Rebecca passed 50 6 times)
- Dylan, Luke, and MatthewR were the only managers to not score under 20 in a gameweek
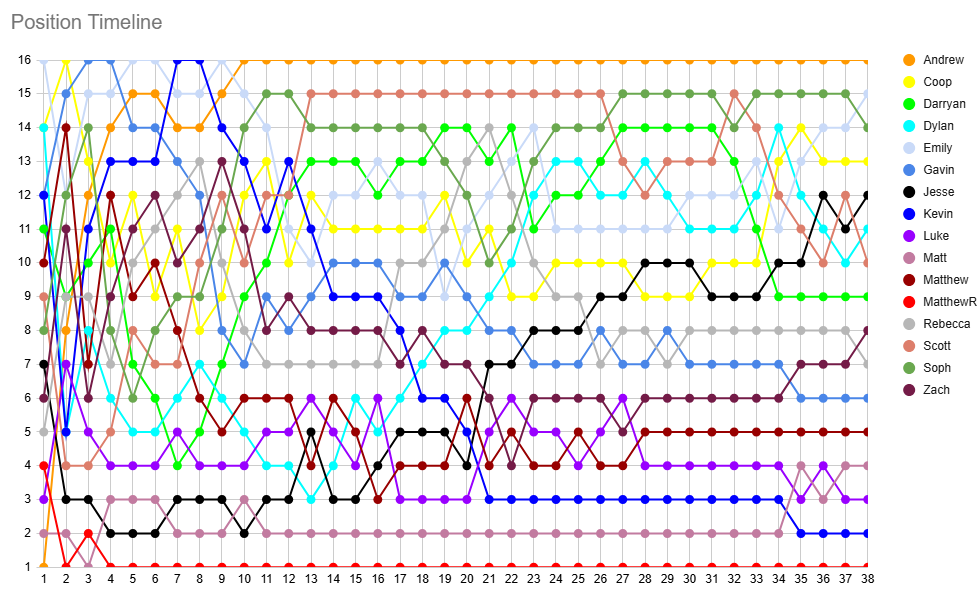
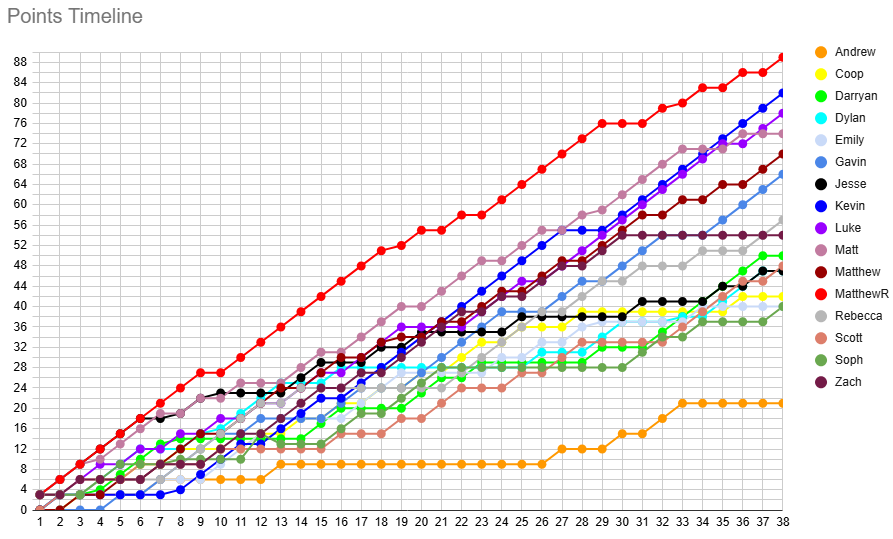
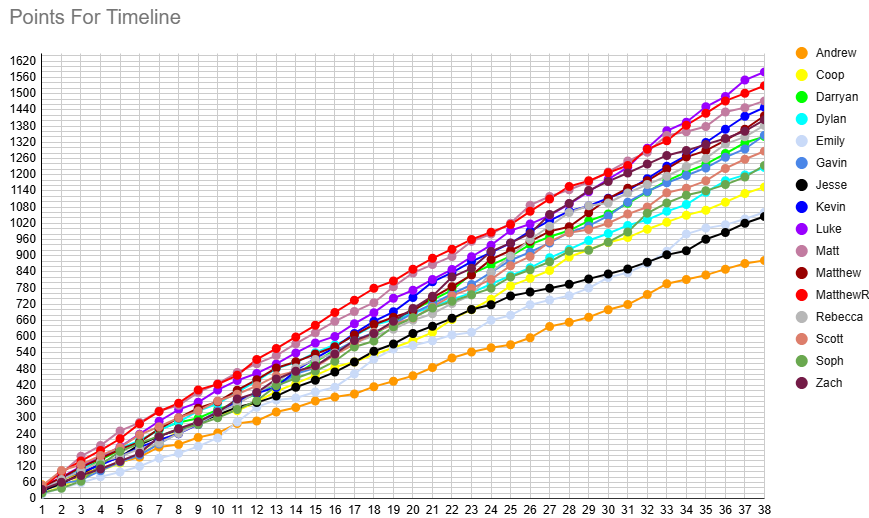
Timelines
Honestly, not a lot to say about the timelines, but they are fun to look at so here ya go!
Position Timeline
Points Timeline
Points For Timeline
Records
Unfortunately, I need to get my affairs in order when it comes to automatically comparing records data between seasons. That'll happen soon, but it isn't yet ready! But what I can share are some fun records from this season.
To start though is the record that will be entering the history books: tied for 5th most points (ever) in a single gameweek, Rebecca in GW24 with 84 points.
Highest Single Gameweek
- Rebecca, Gameweek 24 vs Coop: 84
- Zach, Gameweek 22 vs Luke: 71
- Luke, Gameweek 32 vs Scott: 71
- Zach, Gameweek 27 vs Emily: 70
- Soph, Gameweek 32 vs Jesse: 69
Lowest Single Gameweek
- Soph, Gameweek 29 vs Zach: 4
- Emily, Gameweek 14 vs Matt: 7
- Andrew, Gameweek 8 vs Gavin: 9
- Andrew, Gameweek 12 vs Dylan: 9
- Emily, Gameweek 23 vs Rebecca: 10
Biggest Victory
- Matt, Gameweek 26 vs Jesse: 67-14 (53)
- Zach, Gameweek 27 vs Emily: 70-18 (52)
- Matt, Gameweek 3 vs Gavin: 63-13 (50)
- Rebecca, Gameweek 24 vs Coop: 84-39 (45)
- Zach, Gameweek 24 vs Jesse: 62-17 (45)
High Combined Gameweek
- Rebecca vs Coop, Gameweek 24: 84-39 (123)
- Zach vs Luke, Gameweek 7: 62-48 (110)
- Zach vs Luke, Gameweek 22: 71-37 (108)
- Matt vs Rebecca, Gameweek 36: 54-53 (107)
- Rebecca vs Gavin, Gameweek 14: 55-51 (106)
Lowest Combined Gameweek
- Emily vs Jesse, Gameweek 28: 16-15 (31)
- Scott vs Jesse, Gameweek 34: 17-15 (32)
- MatthewR vs Scott, Gameweek 29: 21-12 (33)
- Zach vs Scott, Gameweek 15: 20-16 (36)
- Jesse vs Coop, Gameweek 31: 19-18 (37)
Highest Score in a Loss
- Rebecca, Gameweek 36 vs Matt: 53-54
- Gavin, Gameweek 14 vs Rebecca: 51-55
- Matt, Gameweek 20 vs Kevin: 51-53
- Rebecca, Gameweek 27 vs Scott: 49-55
- Luke, Gameweek 7 vs Zach: 48-62
Lowest Score in a Win
- Emily, Gameweek 28 vs Jesse: 16-15
- Scott, Gameweek 34 vs Jesse: 17-15
- Jesse, Gameweek 31 vs Coop: 19-18
- Zach, Gameweek 15 vs Scott: 20-16
- Soph, Gameweek 1 vs Emily: 21-17
Weekly High Scores
- 5 - Luke and Matt
- 4 - MatthewR
- 3 - Emily, Gavin, Rebecca, Soph, Zach
Weekly Low Scores
- 13 - Andrew
- 9 - Emily
- 4 - Soph
- 3 - Coop and Jesse
Manager of the Month Wins
- 3 - Kevin and MatthewR
- 2 - Luke
- 1 - Emily, Matt, Matthew
Most Game Changers Appearances
- 12 - Mohamed Salah
- 9 - Cole Palmer
- 7 - Alexander Isak and Matheus Cunha
- 6 - Morgan Rogers
Highest Game Changers Total
- 177 - Mohamed Salah (14.75 avg)
- 117 - Cole Palmer (13.0 avg)
- 89 - Alexander Isak (12.71 avg)
- 80 - Matheus Cunha (11.43 avg)
- 60 - Morgan Gibbs-White (12.0 avg)
Highest Game Changers Average (min. 2 apps)
- 16.67 - Justin Kluivert (3 apps)
- 14.75 - Mohamed Salah (12 apps) and Erling Haaland (4 apps)
- 14.33 - James Maddison (3 apps) and Leandro Trossard (3 apps)
Cups
And lastly, let us take a quick look at our 3 cups from this season!
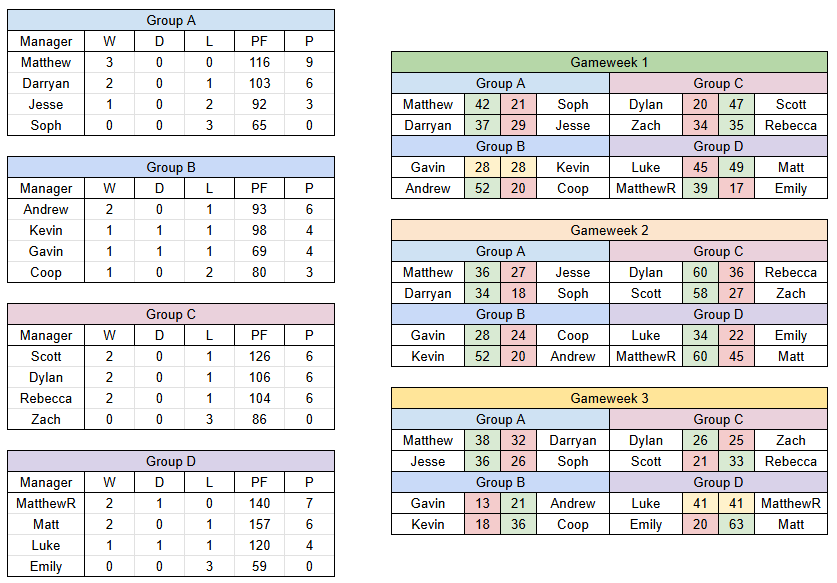
Kick-Off Tournament
As a quick reminder, Scott won this one in the best of one final against me, 37-24!
Our other semi-finalists were Zach and Kevin!
Kick-Off Cup: Group Stage
Kick-Off Cup: Knockout Bracket

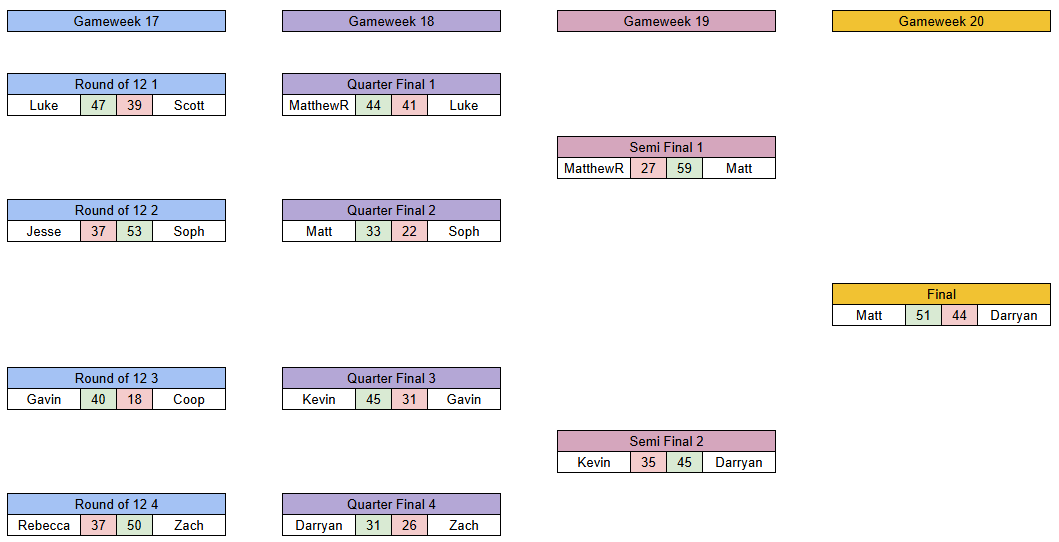
Short n' Sweet Tournament
The Short n' Sweet cup was won by Matt, who took a surprisingly high scoring final against Darryan 51-44!
The 3rd and 4th place contestants were Kevin (again) and MatthewR!
Short n' Sweet Cup: Group Stage

Short n' Sweet Cup: Knockout Stage
Champions Tournament
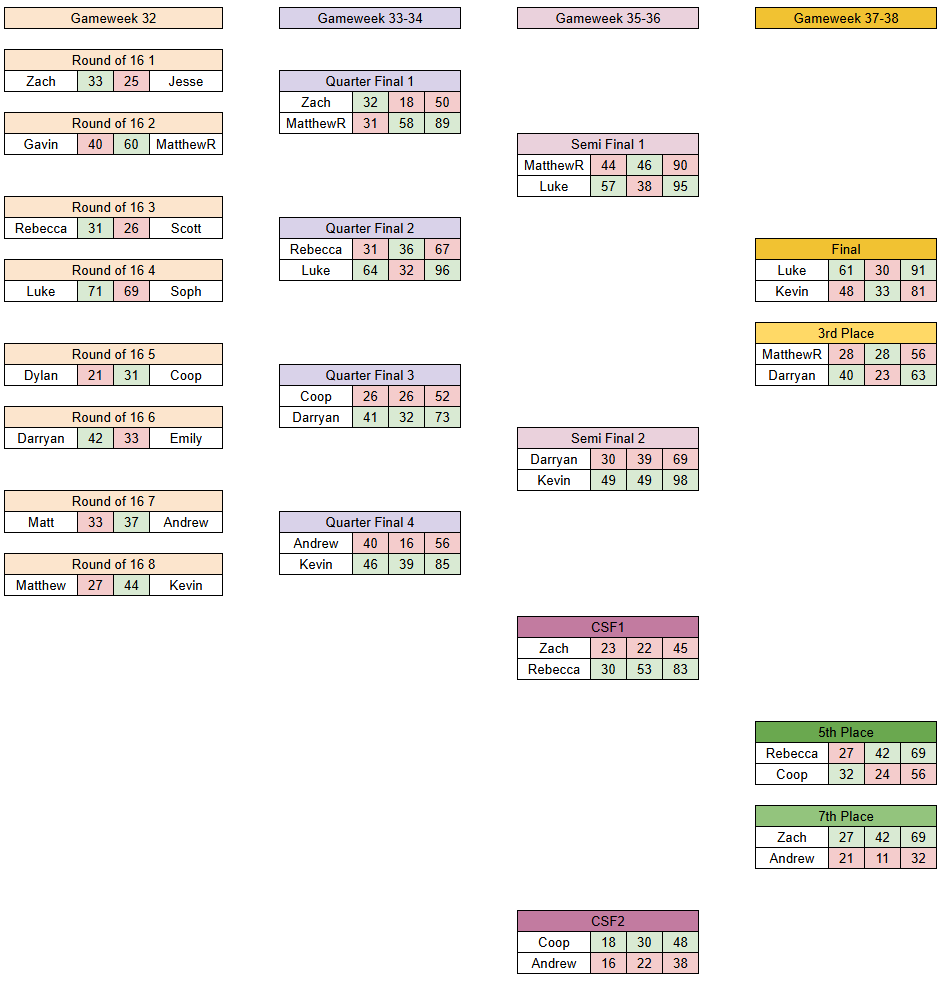
This behemoth of a tournament was won by Luke, who took the final 91-81 over Kevin over the two legs.
Also, Darryan won the 3rd place match against MatthewR, 63-56!
Champions Cup: Group Stage

Champions Cup: Knockout Stage 1st-8th
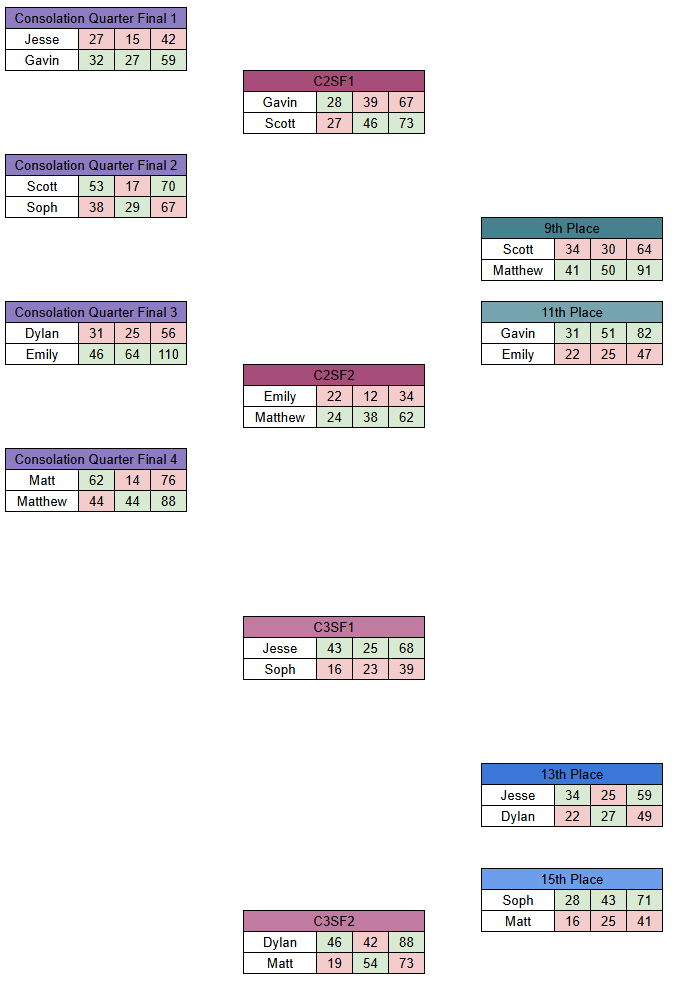
Champions Cup: Knockout Stage 9th-16th
Of course, I'll be using your feedback regarding the formats, communications, and anything else to revamp and reassess how next season will look! Thank you all so much for all the helpful comments and please do keep providing them!
And lastly, the Accolades Voting Form is live! Vote here for things such as manager of the season etc! https://forms.gle/n9RBzhUBV54e97Pu7
Invite new people for Game of Stones League B next season!! Send them this form! https://forms.gle/sZdFSpgJ5nMmhGUr5